Suggested Analysis
You’ve been asked to build a high-level KPI report for the executive team, based on a subset of patient records. The purpose of the report is to give stakeholders visibility into the hospital’s recent performance, and answer the following questions:
- How many patients have been admitted or readmitted over time?
- How long are patients staying in the hospital, on average?
- How much is the average cost per visit?
- How many procedures are covered by insurance?
Power BI dashboards
Dashboard 1

Dashboard 2

Results
- This is an analysis of a synthetic data set created to simulate a hospital in Massachusetts.
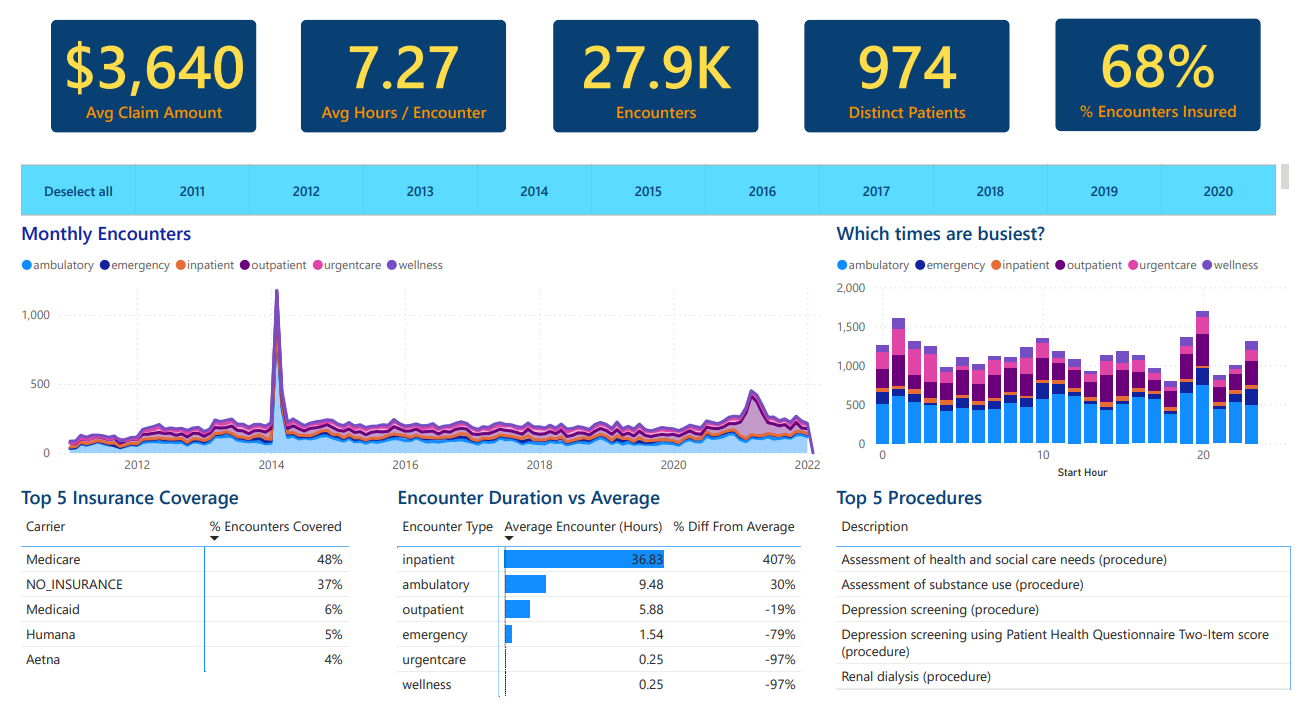
- Over the span of years from Jan 2011 to Jan 2022, there were 27,900 encounters, 974 distinct patients, the average claim was $3,640, encounters averaged approximately 7 hours 18 minutes, and 68% of encounters were insured.
- While ambulatory encounters were most common and drove hourly encounter trends, inpatient encounters took the most time on average.
- The average encounter time of 7 hours 18 minutes was increased by a spike of encounters in February 2014, a year with encounters longer than average.
- Medicare, Medicaid, Humana, and Aetna were the top four insurance carriers, accounting for 63% of encounters.
- 37% of encounters, however, were uninsured.
- Other insurance carriers accounted for the other 10% of encounters.
- The top procedures were assessments of health and social needs, substance use, depression screening, and renal dialysis.
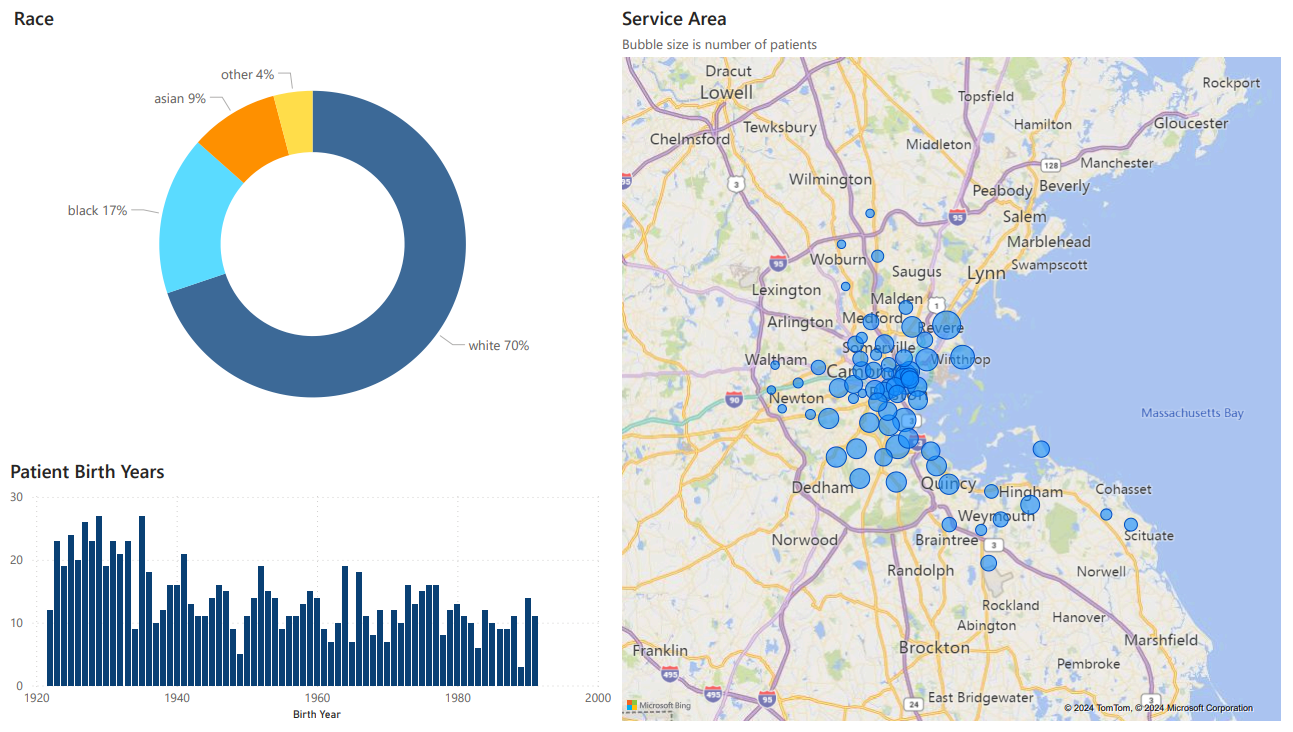
- 70% of patients were white, 17% were Black, 9% Asian, with the balance being other races.
- The hospital served patients from around the Boston Metropolitan Area.
Citation
Jason Walonoski, Mark Kramer, Joseph Nichols, Andre Quina, Chris Moesel, Dylan Hall, Carlton Duffett, Kudakwashe Dube, Thomas Gallagher, Scott McLachlan, Synthea: An approach, method, and software mechanism for generating synthetic patients and the synthetic electronic health care record, Journal of the American Medical Informatics Association, Volume 25, Issue 3, March 2018, Pages 230–238, https://doi.org/10.1093/jamia/ocx079
Tools Used
- Power BI